
Let’s keep digging into the association between Google searches and the number of people starting PrEP drugs by fitting a poisson model of the time series in R. We’ll use this work-in-progress to kick off a discussion on validation of models used to forecast utilization.


To review:
- First, we first noticed a similarity in the trends of Gilead’s reported Truvada use for PrEP and the frequency of “HIV PrEP” Google searches in the United States.
- Second, we fit a linear regression model using time and Google Trends to predict the cumulative number of people initiating PrEP each month.
- Lastly, here we fit a simple poisson generalized linear model for time series data and examine the validity of its predictions to use in forecasting the number of people we expect to be using PrEP in the future.
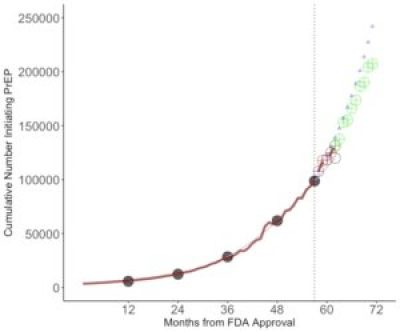
When I look at Figure 1, it seems using Google Trends to forecast PrEP utilization (colored circles) doesn’t get you much more “oomf” than just using a single variable for time since FDA approval alone (tiny blue triangles). It could be that the farther out you forecast the more helpful incorporating Google searches could be in improving precision. If past associations between Google searches, time, and users hold steady, then we may observe a doubling in the number of the people who have ever used PrEP within 2017.
How do we approach validation of this? Remind yourself there are many different types of validity and we can’t assess them all (most of the time). Content validity, face validity, predictive validity, construct validity, cross-validity, and external validity are a my favorites. Face validity means we should be able to explain all results and sensitivity analyses because they make logical sense in the context.
Figure 1 shows my stepwise approach to predictive validation. We fit the model with outcomes data only up to a certain point in time (I data up to 36, 48, and 60 months) and then predict outcomes each month in the following 12 months. As you follow the panels from left to right, you can see how closely the predictions match the real observed data.
For cross validation, we can compare these model predictions to Gilead’s predictions and feel more confident if the results are similar from two independent models. Gilead estimates 120,000 users in Q1 2017 and here we estimate 13,1412 users in February 2017. That is pretty darn close. It makes me feel a bit more confident about our simple model. This Gilead abstract from AIDS 2017 identified three distinct periods of uptake, and I imagine they used a spline model to understand the recent plateau. That difference could explain why their their prediction was a bit lower.
I personally think the best way to validate a model is to make a prediction when you don’t know the outcome yet, stick it in the freezer, and wait around to compare your answer to what happens in the real world. That is external validation. So, I am going to take a risk and place my MY BEST BET: in October 2017 I bet there are 183,624 individuals* who have initiated PrEP in the United States (*if calculated by the same methods and assumptions previously used by Scott McCallister’s group at Gilead).
My conclusion from this quick and dirty analysis is that while Google trends may be a valid tool to forecast the uptake of a new drug, the results are not much different from using time alone and so adding Google trends might not be not worth the extra effort.
…though it might be worth the effort if the last measurement of your outcome was a long time ago. See the last bullet in Next Time below for a hint in how we could figure this out.
NEXT TIME
What I would do differently if I were to repeat or continue on this analysis:
- A negative binomial model might have been a better choice because assumes each event is independent, since this assumption was likely violated in our example of PrEP uptake.
- The most flexible model choice would have been to to use Extended Estimating Equations (EEE) developed by Professor Anirban Basu. Since the EEE package is in Stata and I prefer R, I avoided it this time.
- Try to implement a poisson exponentially weighted moving average model
- I am too lazy to look up the R equivalent of Stata’s stset command to set the panel data, so I just threw in time as a variable. That probably does not tackle the autocorrelation problem. Since the goal is to forecast, it might be okay here.
- In a real analysis, I would run a lot of tests to check for heteroscedasticity and examine the model fit. We skip that in this quick and dirty analysis.
- Keep going to closely examine difference between the residuals in each of the models with Google Trends and time compared to the corresponding models with time alone. Is the difference big enough that I should care about it? Would adding a parameter for Google trend only help if I am trying to forecast something really far in the future from my last observed outcome data point?
If you have other suggestions on alternative approaches, I invite you to share your thoughts by posting a comment below.
References: The frequency in Google searches over time is from Google Trends (www.google.com/trends) and the number of PrEP users each year is from Mera R et al. Changes in Truvada for HIV pre-exposure prophylaxis utilization in the USA: 2012-2016. 9th International AIDS Society Conference on HIV Science, Paris, July 2017.
* If anyone from McCallister’s group at Gilead reads this blog post, please, please, please follow-up with me after you finish calculating the real numbers for 2017 utilization and let me know how well these Google predictions perform.